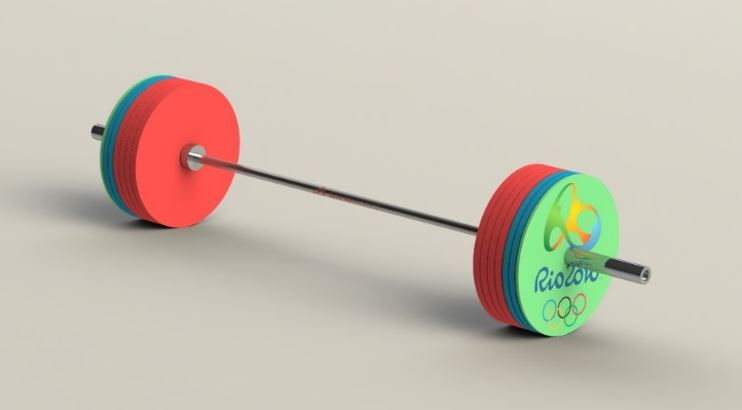
Now the 2016 Summer Olympics in Rio is over, we can reflect on the strength and determination athletes require to compete and be the best in the world. Using SOLIDWORKS Simulation we'll take a look at how an Olympic barbell is loaded for world record attempts and is engineered to be safe enough to be able to withstand the best that Olympians can throw at it.
It’s
always intriguing to witness the strength of Olympic athletes competing in
sports such as weightlifting. But how often do we stop and consider the
strength and safety of the Olympic equipment in use? Suspending hundreds of
kilograms above your head is never a good idea if you’re not sure how well the
equipment will hold up so let’s see how we can use SOLIDWORKS Simulation to
help us understand how strong an Olympic spec barbell really is...
Loading Scenarios Tested:
-
Static (500kg and with
remote load support)
SPECIFICATION:
The first step was to model an Olympic
bar alongside a set of standard weights according to Olympic/IWF specifications
(weight designated by colour) using SOLIDWORKS. The extensive SOLIDWORKS materials
library provided the properties for each component of the assembly. Utilising the
Mass Properties and Measure tools allowed the volumetric dimensions of the
parts to be modified to meet weight specifications.

Barbell: Stainless Steel [28mm diameter, 2m length, 20kg Total]
Barbell Ends: Chrome Steel [50mm diameter to fit weights]
Weights: Rubber Coated Grey Cast Iron [50mm centre hole, 450mm
diameter]
THE CURRENT RECORD:
The current Olympic record for weight lifted was
approximately 263kg in Athens 2004 by the powerhouse Hossein Rezazadeh in the
clean and jerk event. Modelling the complete lift would be better suited to a
SOLIDWORKS Motion Analysis study. However, in this case in order to see the
forces this would exert on the barbell using SOLIDWORKS Simulation we would use
a snapshot of the lift at a key point at which the barbell would be fully
suspended above the head.
SIMULATION:
A static simulation was conducted
at first by rigidly fixing the bar at the centre, representing it as a loaded
beam and applying a symmetry condition to model only considering one half of
the bar. It was then possible to extract the resultant displacements alongside reaction
forces under applied gravity.
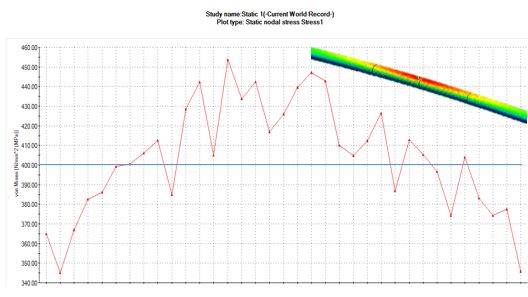
Utilising the graphical output
option in the probe tool, the distribution of stress at a selection of points around
the centre of the bar could be identified. Maximum stress under these
conditions was 461MPA (400 average) resulting in around a 5 cm deflection at
the tips.
The
stainless steel bar has a yield strength of around 513 MPa and from the first
result the skin stress was approaching the plastic deformation region but to
see the extent of this, the mesh sectioning or section clipping options could be
used to see the stress through the cross section ensuring it stays below the
max allowable stress.

Typical Olympic bars are rated to a maximum of 700kg
before failure.

Applying 20 x 25 kg weights took
the total weight of the barbell to over 500 kg at which point Herculean
strength would be required to lift this above the average human head however
the bar still managed to withstand the loads exerted as seen by the Stress
plot. Deflections at the extreme ends of the bar were 80mm which would be quite
evident when lifting. Repeated lifts of the bar would potentially result in the
bar not returning to its original shape having plastically deformed but would
be understood better through a fatigue study.
In
SOLIDWORKS 2016 the ability to section meshes provides useful insight in to
the stresses inside the bar through the cross sectional elements in 3D. This
ensures that a fine enough mesh is being used to capture the behaviour inside a
part or component and be refined if required. These options are found under the
mesh quality entry or under the results context menu in the simulation tree.
Using this tool, it is possible to analyse the barbell and clearly see the high
tensile and compressive stresses at top and bottom (outer radial region) of the
bar.

So far only rigid constraints from the centre were
considered as it’s often difficult to accurately represent the changing
constraints on the barbell when being lifted at any point during the clean and
jerk (suspended above the head for example). One way to overcome this is
through the use of remote loads to represent the forces and contact conditions indirectly
exerted on the bar. For example, the reaction force of an athlete supporting
the bar hence counteracting the weight force to some degree without applying
additional contact constraints to the bar.

This ensured that the model would
not be over constrained by rigidly fixing it in the areas where some movement
would still occur (e.g. holding the bar at the grip handles). Why? Because over
constraining meant a reduction in degrees of freedom at nodes along the bar
that should otherwise be free to move. Doing so would me a reduction in how
accurately the load was distributed through the entire span of the barbell and
key information about how the barbell behaved when loaded would be lost in the
simulation.
Assuming a super Olympian thrust
the bar vertically upwards with an acceleration of 0.5 m/s^2 with a split
second force of 5370N the barbell would still be able to withstand the load
with around 520MPa max tensile stress and an 8cm deflection at the tips as seen
by this simulation. Under these extreme conditions a safety factor plot could
be used to explore the distribution of material strength with respect to the
loading conditions. Whilst the outer surface of the barbell showed a high
stress concentration, the rest of the bar was able to withstand the forces and
remained in a safe region.


To summarise, we have seen how we can use a variety of
SOLIDWORKS tools with a simple static set of simulations to see if the
performance of the barbell is up to par with the performance of Olympians. It’s
safe to say that the next person to break the record doesn’t need to worry
about breaking the bar, even if they manage to raise it…


Sameer Qureshi
Applications Engineer